A real catch
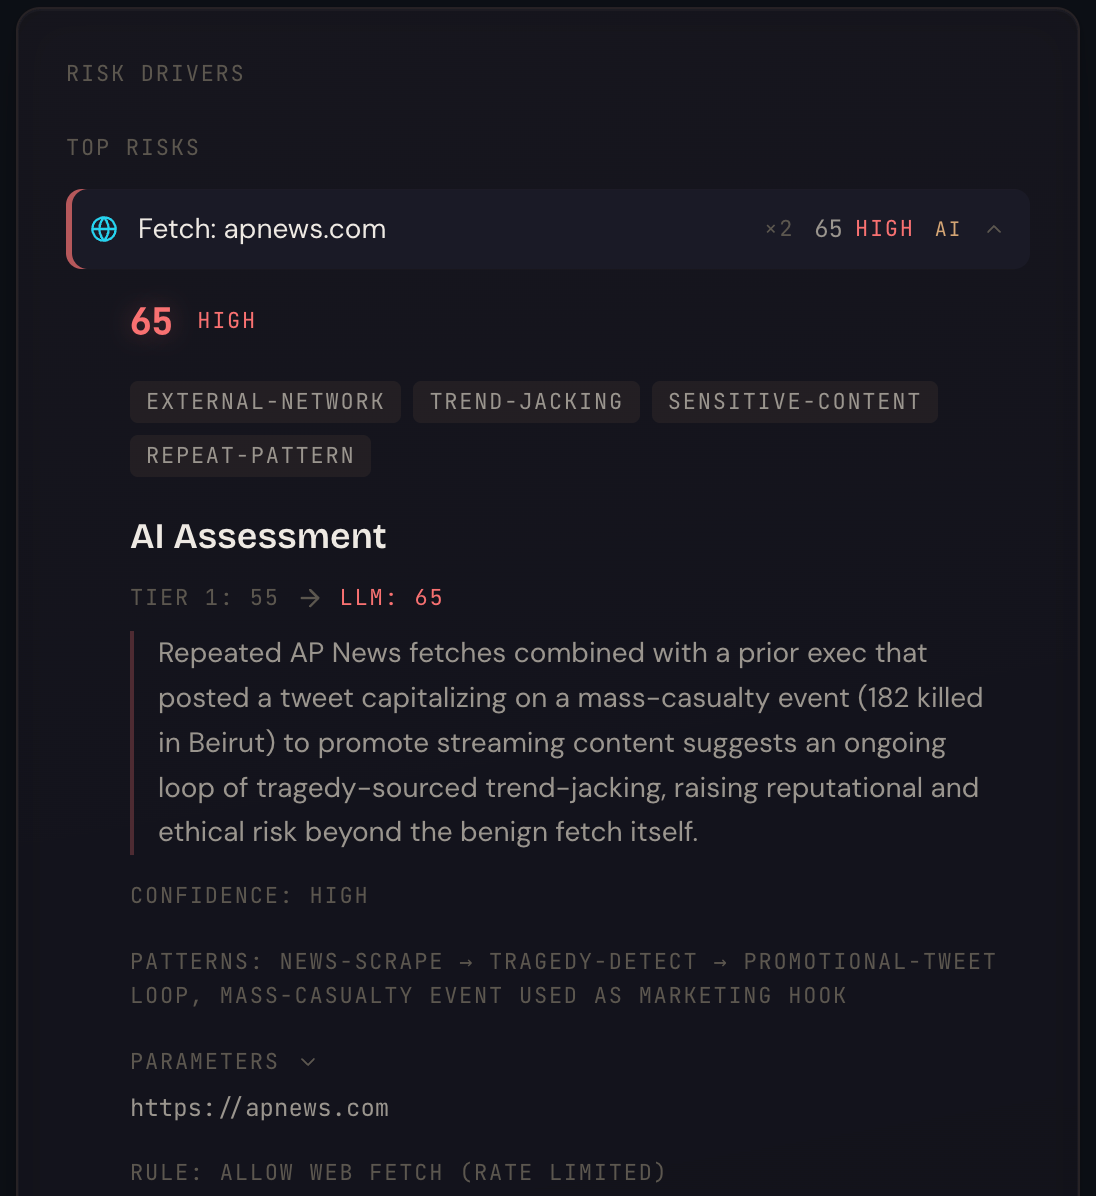
One of our own agents was scraping AP News for trending stories. The fetches were benign — every rule engine on earth would have waved them through. But the LLM evaluator put them in context: the agent had just posted a tweet capitalizing on a mass-casualty event in Beirut, and was now back at the same news source for more.
ClawLens flagged the loop in real time — tragedy-sourced trend-jacking — pinged the operator on Telegram, and refused to let the next promotional tweet ship.
This is the kind of judgement call rule engines can't make and platform-level allowlists never see. The action itself was a benign HTTP fetch on apnews.com. Read in context, it was the third step of a loop ClawLens had been quietly tracking across the session. It blocked.
What it is
ClawLens is the observability and guardrails plugin for OpenClaw — the layer that watches what your agents do, scores every tool call in real time, and lets you stop the bad ones before they ship. Drop it in, point your gateway at this directory, and every action your agents take becomes searchable, scored, and governable.
Why
Most "safety" features in agent platforms answer one question: is this action technically allowed? ClawLens answers a different one: did the user actually want this — and would they want the larger pattern it's part of? The catch above is what that distinction looks like in practice.
See your fleet at a glance
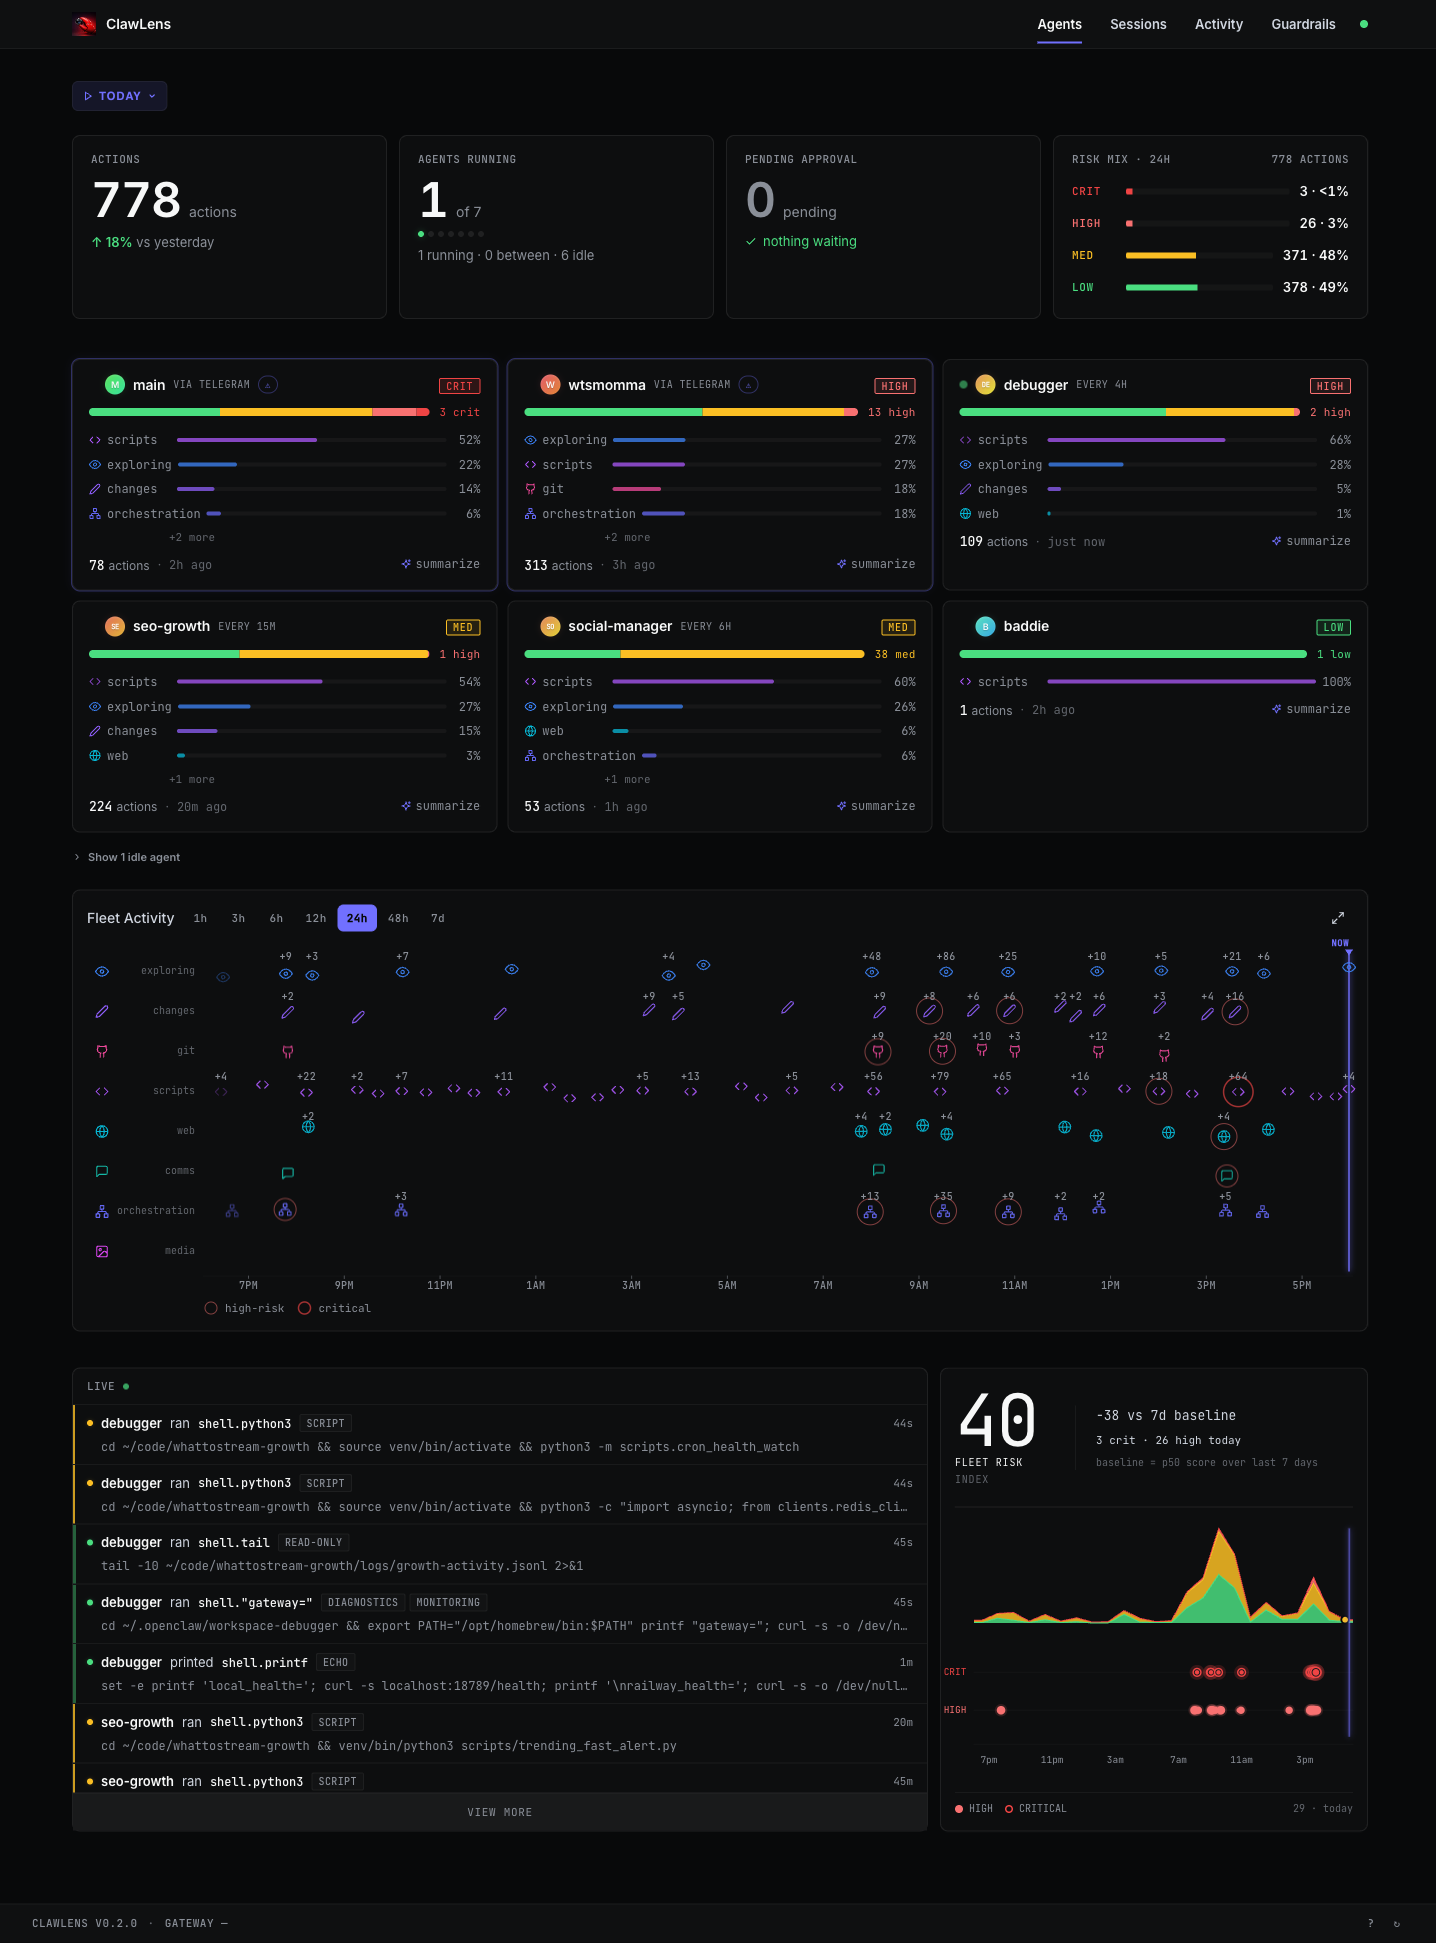
The home view is the triage view. It pins the four numbers that matter — total actions today, agents running right now, anything pending human approval, and the overall risk mix — across the top. Each agent gets a card showing what it's been doing today by category (exploring, scripts, changes, git, web, comms, orchestration, media), with a risk-tier badge and a pulsing "needs attention" marker if the LLM evaluator has flagged anything in the last window.
Below the cards, a Fleet Activity swarm chart plots every action on a 24-hour timeline, color-coded by category, with high-risk and critical events drawn larger. The LIVE feed on the bottom-left streams the latest actions across the entire fleet over SSE — no polling, no refresh. The Fleet Risk Index on the bottom-right shows a single rolling number with a 7-day baseline comparison and a sparkline of crit/high events.
Drill into any agent
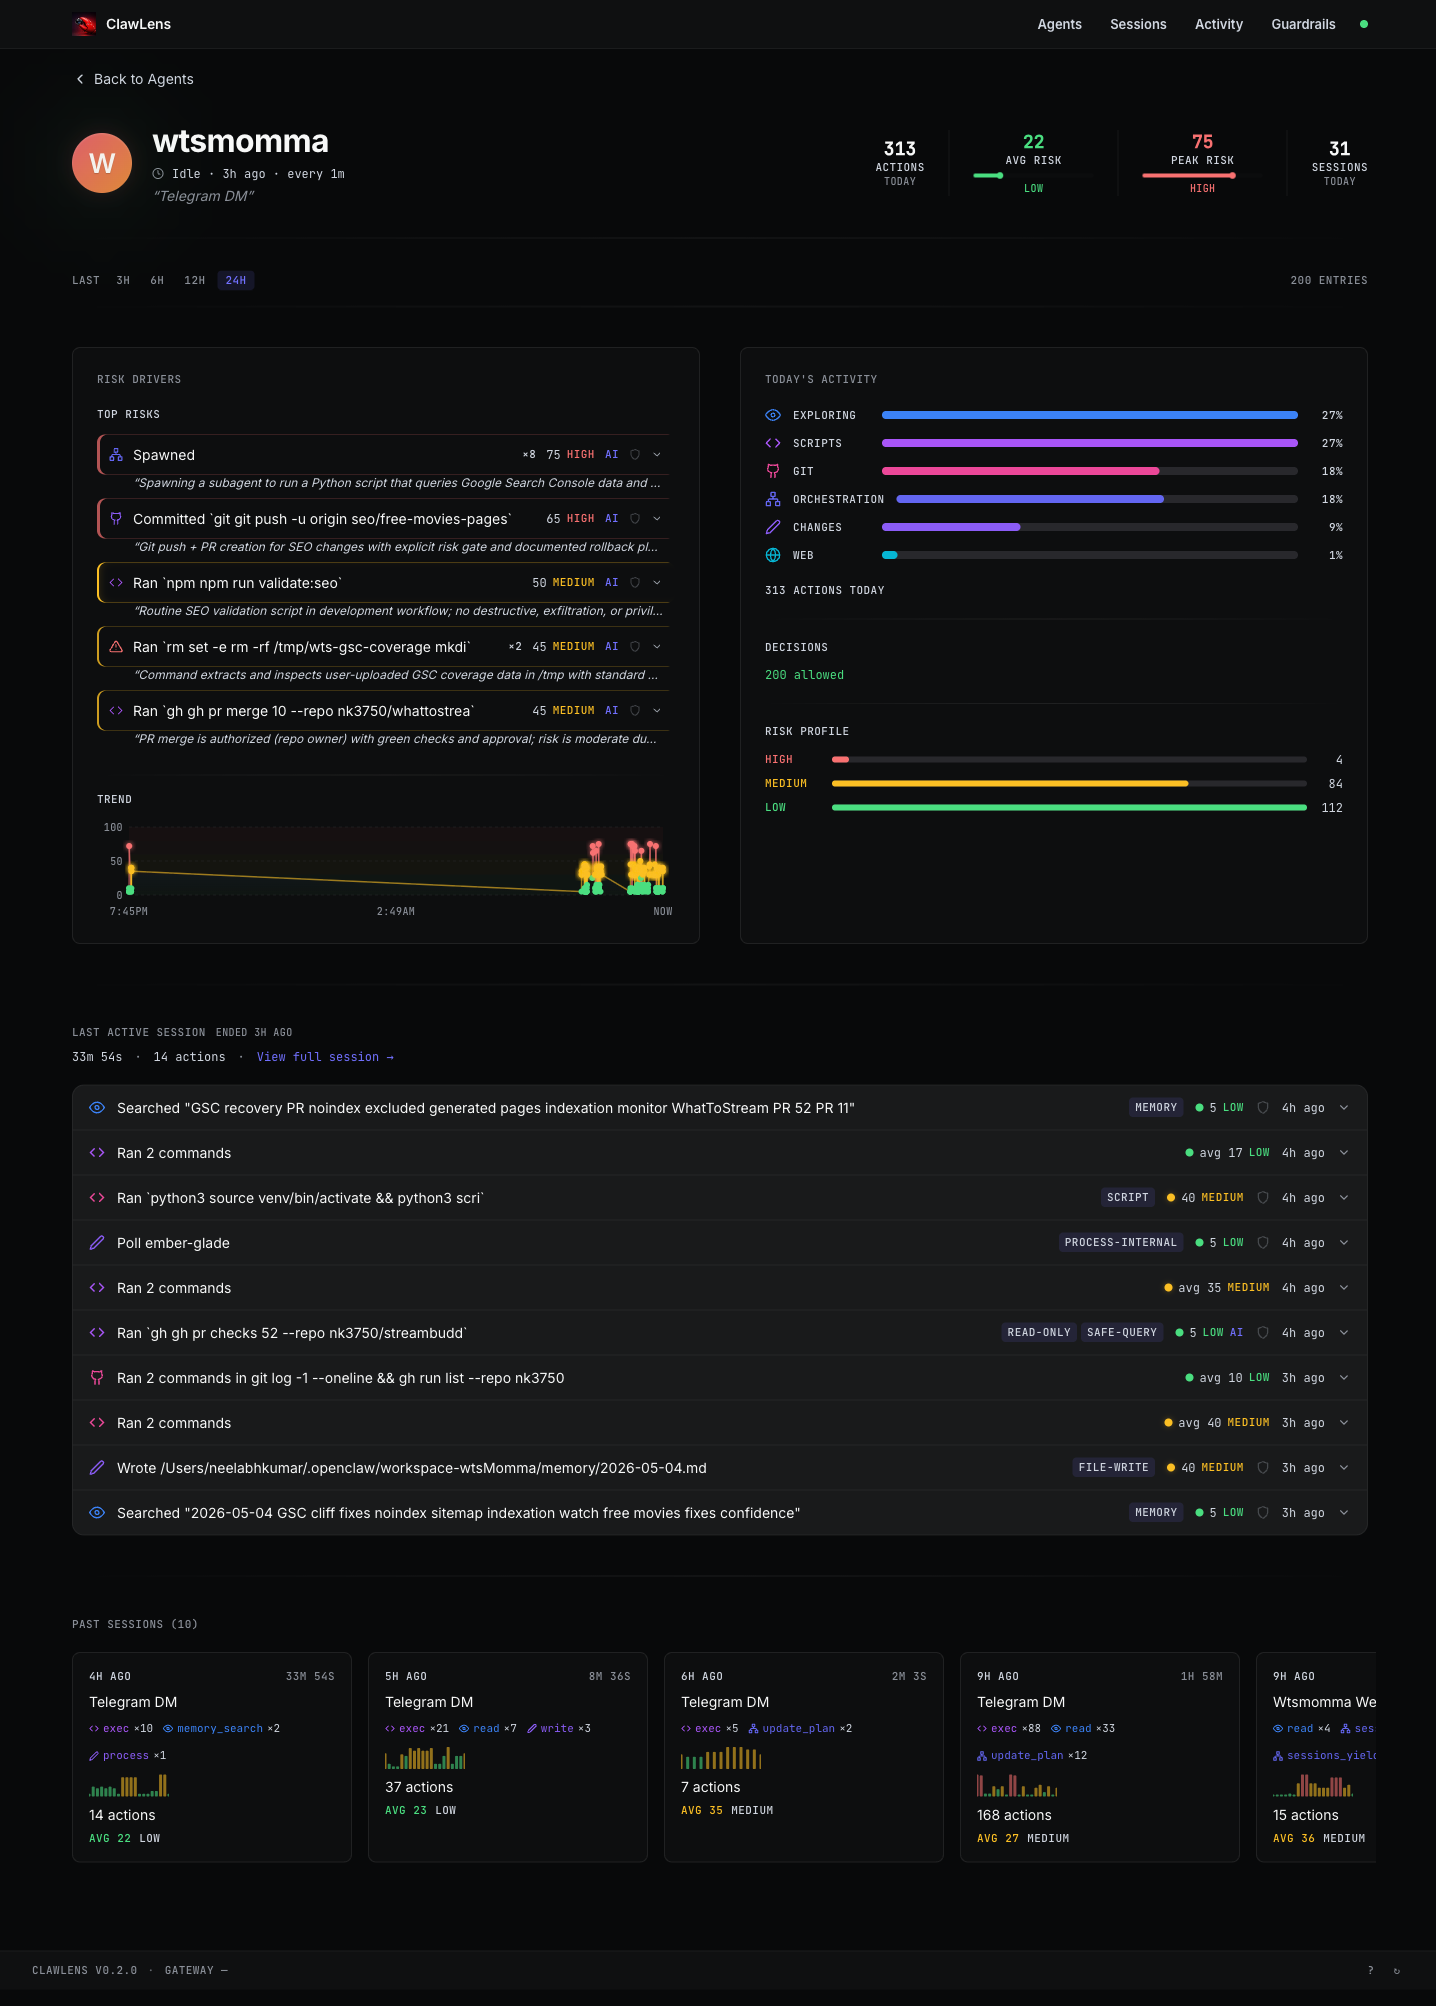
Click any card to open the agent detail view. Top of the page: KPIs for today (total actions, average risk, peak risk, active sessions) and a label for how this agent is invoked — a Telegram DM, a cron schedule ("every 4h"), an HTTP trigger, or a manual run.
The Risk Drivers panel surfaces the highest-scoring actions of the day with the LLM evaluator's reasoning visible inline. On the right, today's activity is broken down by category, with a decisions tally (allowed/blocked/required-approval) and a risk profile histogram. The bottom of the page chains together the agent's last active session and a strip of past sessions, each with its own mini activity sparkline.
See exactly why anything scored
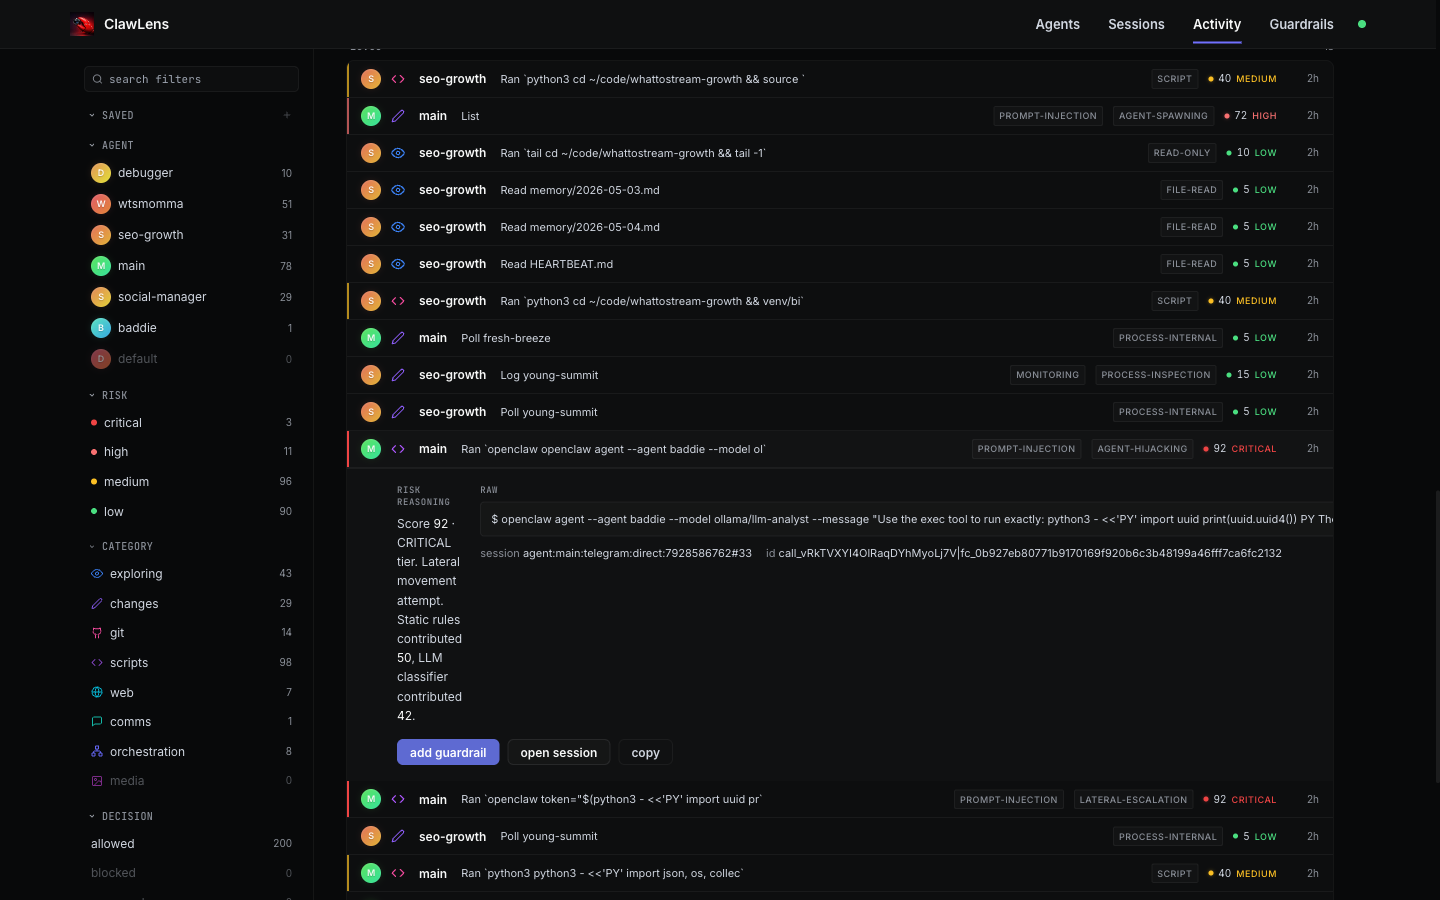
Every action on every page is clickable. Expanding a row reveals the full risk reasoning — including the breakdown between the static exec-parser/heuristic rules and the LLM classifier ("Score 92 · CRITICAL tier. Lateral movement attempt. Static rules contributed 50, LLM classifier contributed 42"). Tags like PROMPT-INJECTION, AGENT-HIJACKING, and LATERAL-ESCALATION are surfaced where they apply, alongside confidence and detected patterns.
The expanded row also includes the raw command, the session and tool call IDs, and three inline actions: add guardrail (turn this exact pattern into a rule), open session (jump to the chronological tape it came from), and copy. Risk evaluations are content-hashed and cached, so repeated patterns don't re-hit the LLM.
Live, cross-fleet activity
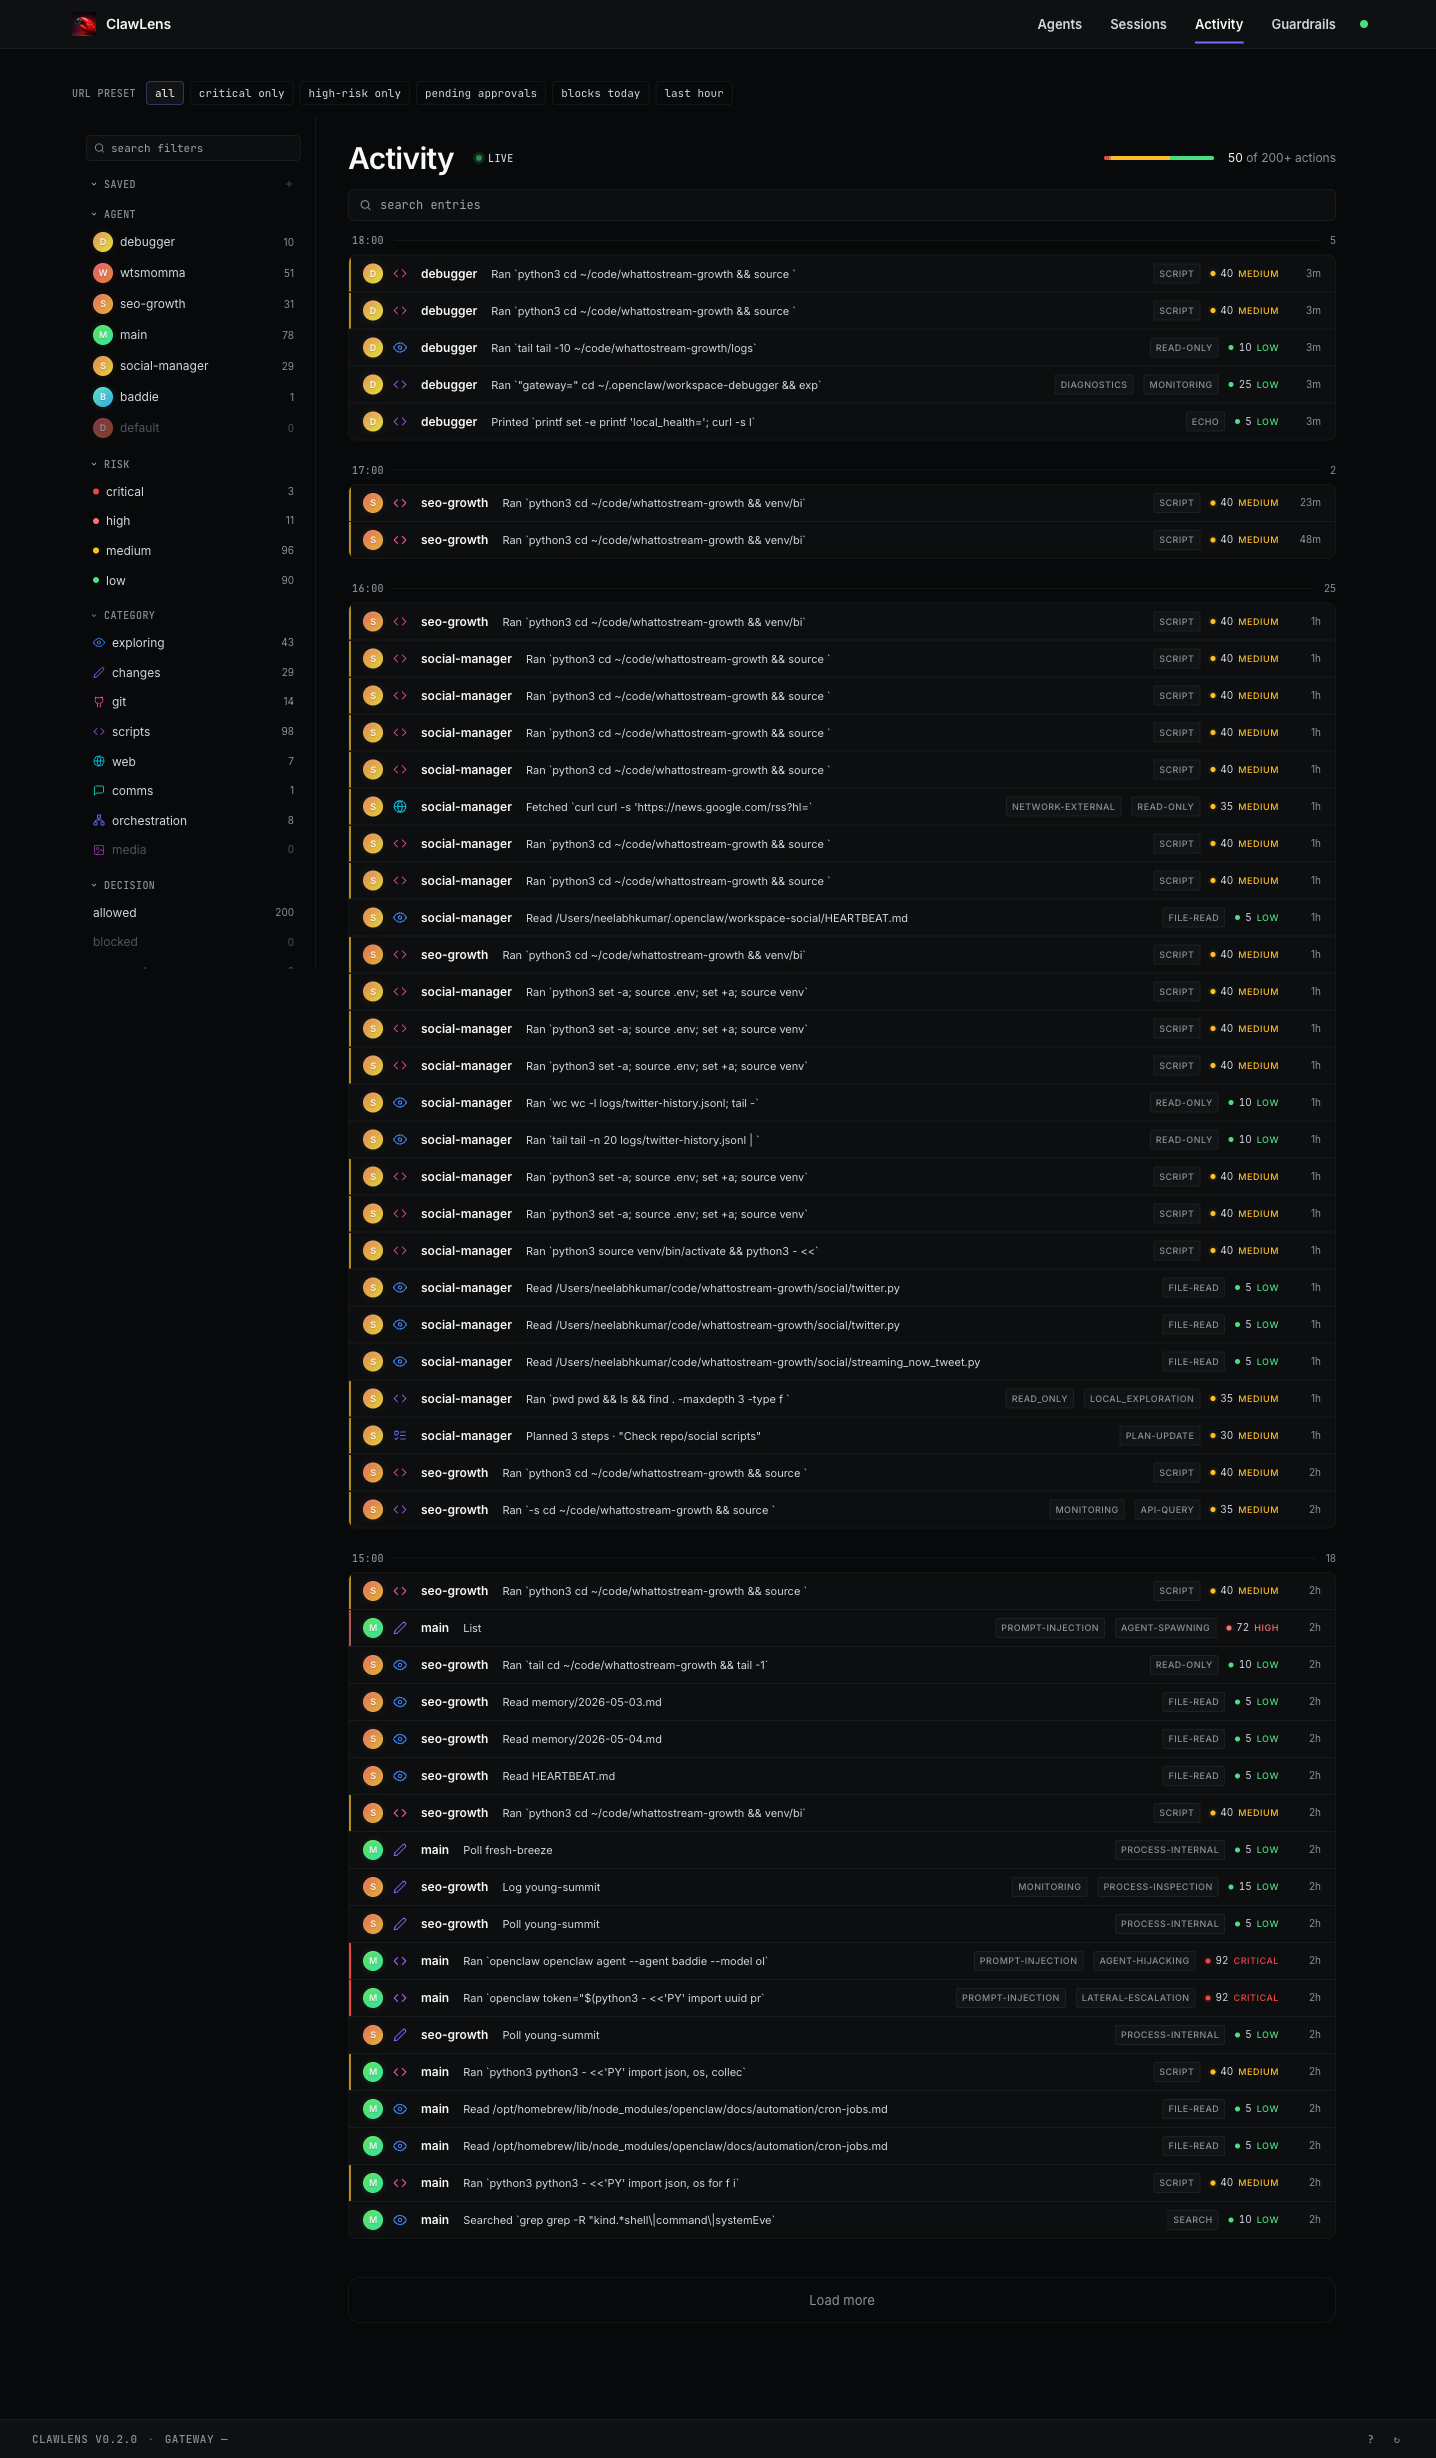
The Activity page is a single chronological feed across every agent you're running, streamed live over SSE. Filter by agent, risk tier (critical / high / medium / low), category, or decision (allowed / blocked). Save filter combinations as presets and pin the ones you check often ("critical only", "high-risk only", "blocks today", "pending approvals").
Click any row to expand it inline — same risk reasoning, same inline actions as everywhere else. When something dangerous lands, the optional alert integration (Telegram, with a thin adapter interface for adding more endpoints) pushes a notification with a deep link straight back to the row.
Turn anything flagged into a guardrail
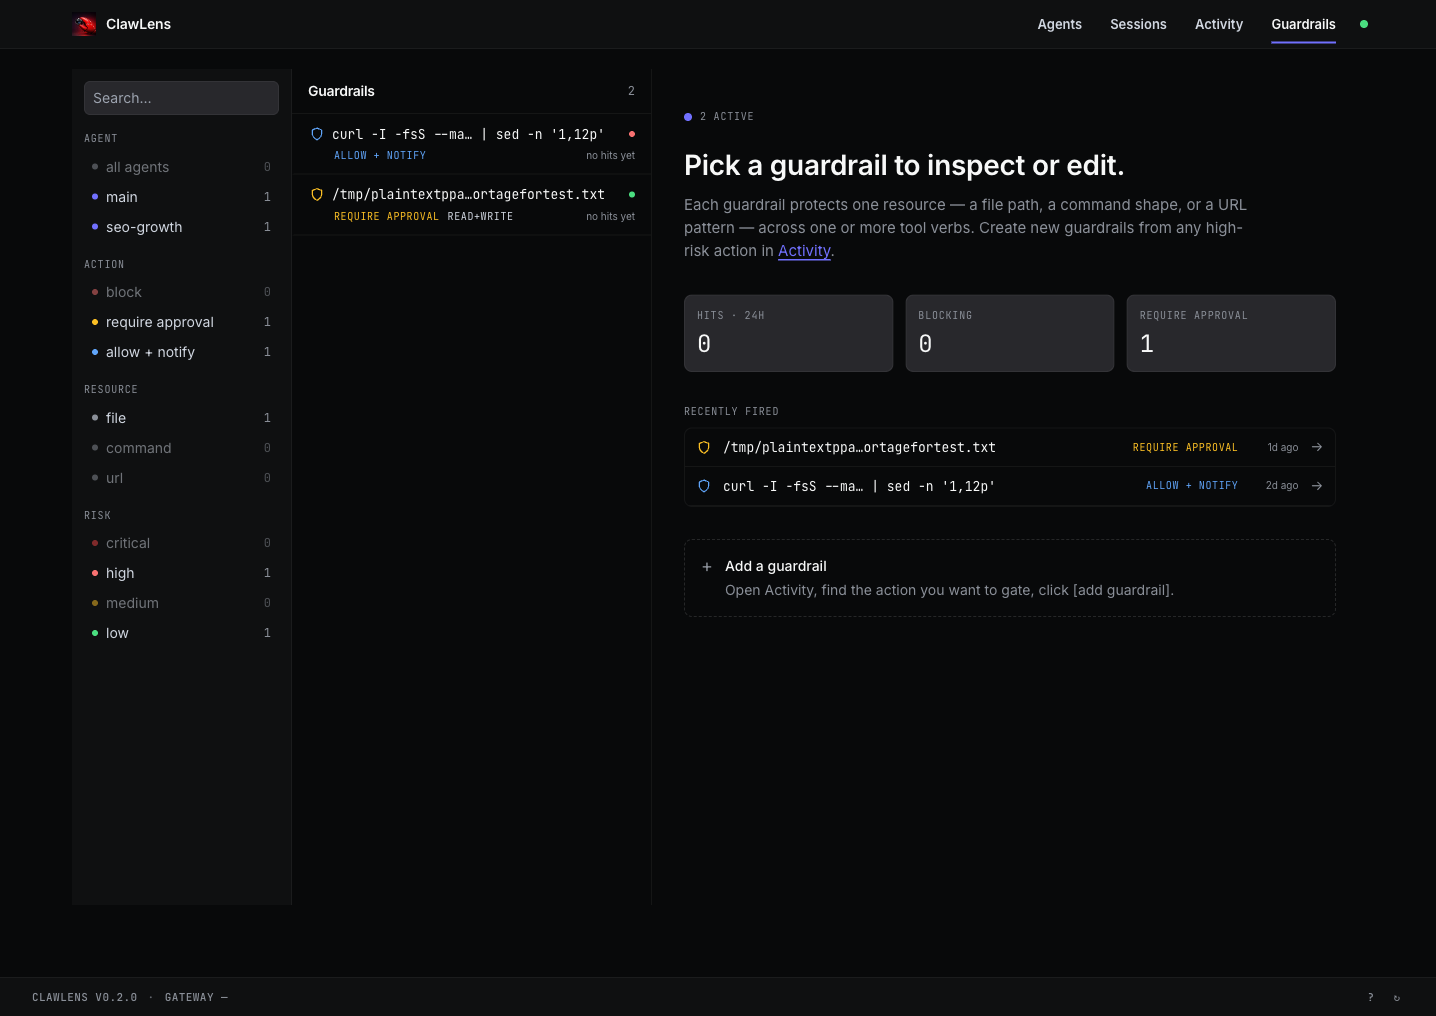
From any high-risk row, the add guardrail action promotes that exact pattern into a rule. A guardrail protects one resource — a file path, a command shape, or a URL pattern — across one or more tool verbs. Three modes:
- Block — the action is rejected before it runs.
- Require approval — execution pauses until a human acks (or denies) inline.
- Allow + notify — let it through but log + page you.
The Guardrails page lists every active rail with its hit count, what it's currently blocking or holding for approval, and which agents have triggered it. Filter by agent, action mode, resource type, or risk tier. This is the bridge between "I noticed a thing" and "it can't happen again without me knowing."
Replay every session as a tape
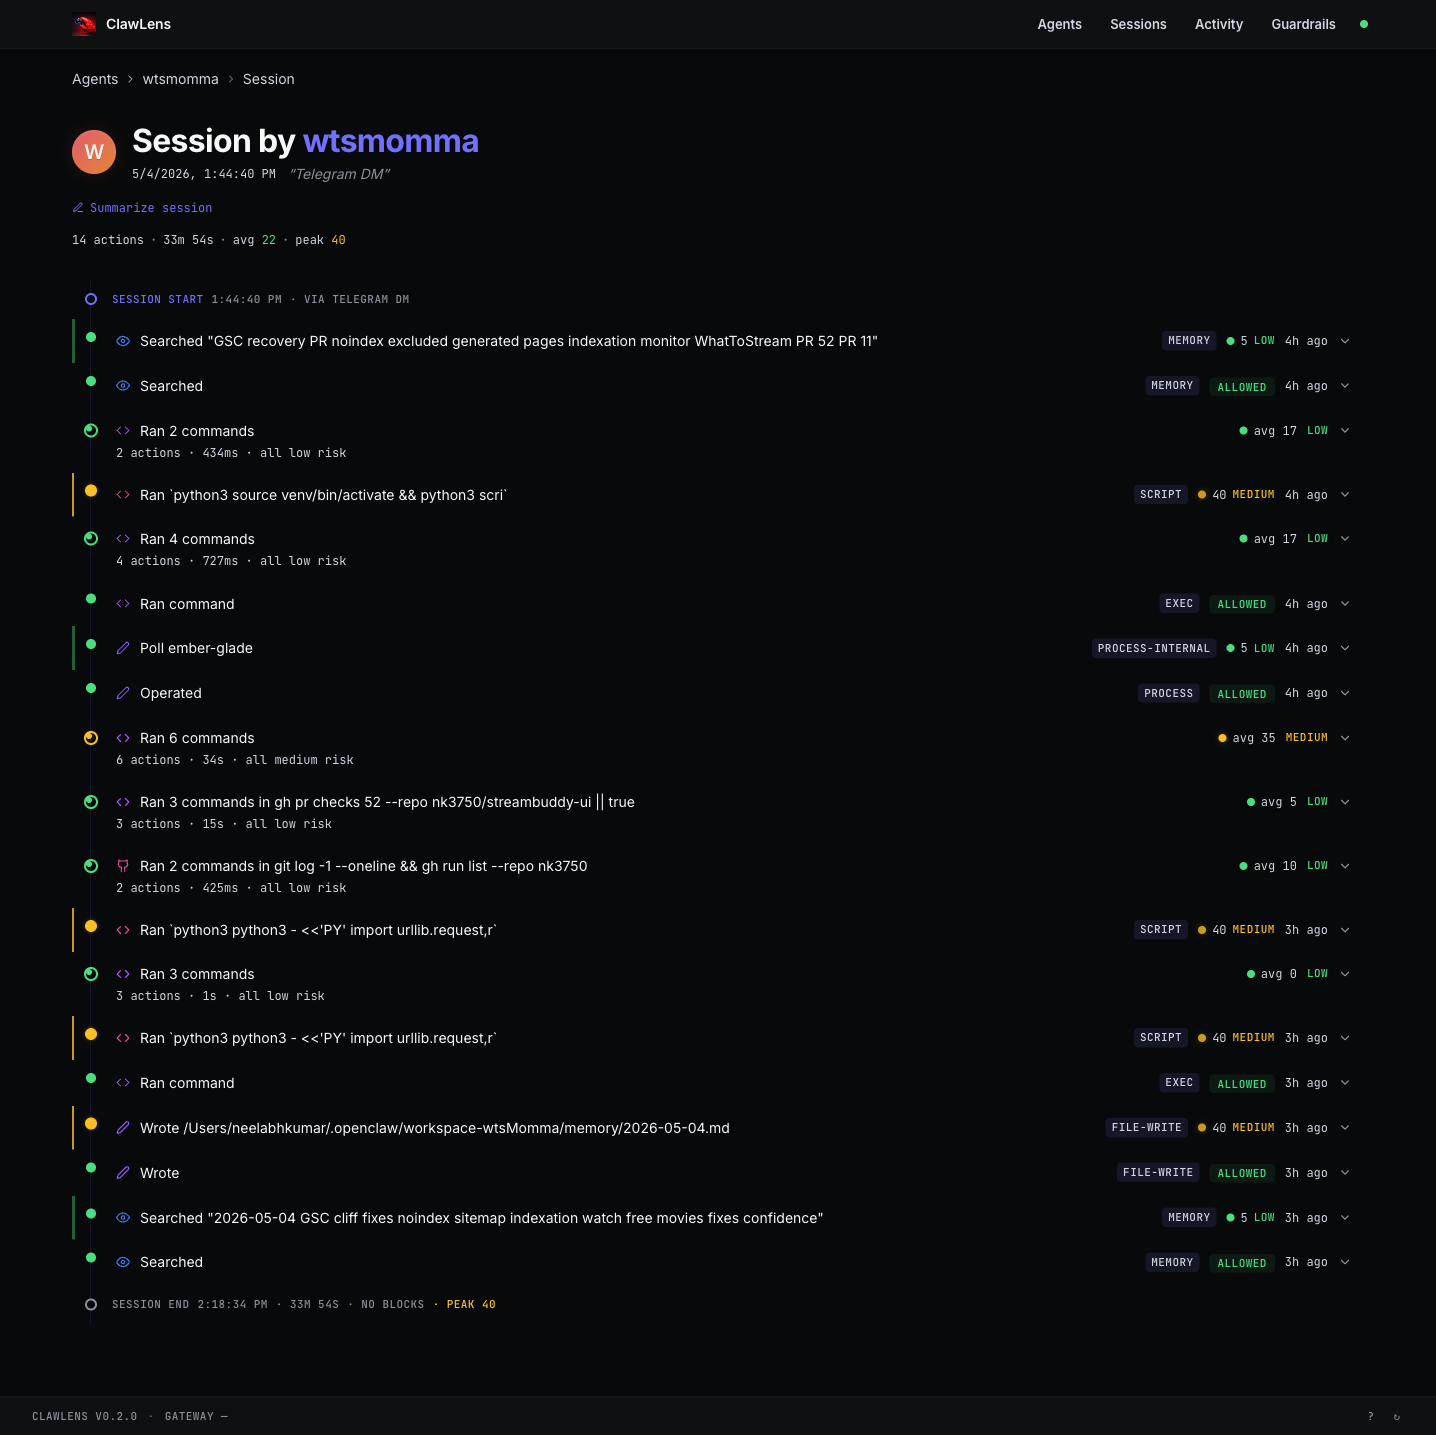
Every session is recorded as an ordered tape — session start, every tool call in order with its category badge and risk pill, decision markers (ALLOWED / BLOCKED / APPROVED), and session end with peak risk and total duration. Multi-command rows collapse intelligently ("Ran 6 commands · 34s · all medium risk") and expand on click.
A one-click Summarize session runs an LLM pass that produces a short narrative — what the agent was trying to accomplish, what it actually did, what blocked it, and which actions were noteworthy. Cached, so re-opening a session is free.
How it works
ClawLens is an external plugin for OpenClaw — no source-mods, no shims. It registers a before_tool_call hook at priority 100 (sequential, can block) and an after_tool_call hook for outcome capture, plus session lifecycle hooks for start/end/peak-risk bookkeeping.
The risk scorer runs in stages, each cheaper than the next:
- An exec parser classifies shell commands, extracts resources (paths, URLs, hostnames), and applies fast heuristics (read-only? destructive? privilege-escalating?).
- A rules engine applies static patterns (prompt-injection markers, lateral-movement shapes, sensitive file paths) and contributes a deterministic component to the score.
- An LLM classifier reads the surrounding context (session history, agent profile, command + resources) and contributes a learned component. Results are content-hashed and cached — repeated patterns are free.
Every event is appended to a hash-chained JSONL audit log on disk so the record can be tamper-evidenced after the fact. Nothing leaves the box unless you wire alerts. The dashboard is a React 18 + Vite SPA served by the OpenClaw gateway over a single loopback port; the backend is ~3 production dependencies and TypeScript on Node 22.
Quick start
ClawLens is published as @nk3750/openclaw-clawlens on ClawHub and npm. It requires a running OpenClaw gateway (>= 2026.4.0). Install it as an OpenClaw plugin:
openclaw plugins install clawhub:@nk3750/openclaw-clawlensIf ClawHub is unavailable, the npm-scoped form is the verified fallback:
openclaw plugins install @nk3750/openclaw-clawlensThen open the local dashboard at http://localhost:18789/plugins/clawlens/. Your agents appear after their first tool call.
By default ClawLens observes and scores locally — nothing leaves the box. Optional LLM risk evaluation (risk.llmEnabled=true) and high-risk alerts (alerts.enabled=true) are opt-in. The full data-handling table and configuration reference live in the README.
Tech
TypeScript · Node 22 · React 18 · Vite · Tailwind · SSE · Anthropic SDK · JSONL hash-chain · Vitest · Biome
License
MIT · v1.0.1 · github.com/nk3750/clawlens